%20-%20Full.svg)


Mathlabs is currently working on developing a comprehensive anomaly detection toolbox that could be deployed on a wide range of use cases. Among others, we are building artificial intelligence assets — with our institutional partners — that will detect fraudulent trading activity in flow trading and forex markets, identify anomalies in spreads of fixed income assets and component failure prediction in the energy sector.
Broadly speaking, anomaly detection is concerned with identifying observations within a data set which differ greatly to the norm or occur infrequently. We take a comprehensive approach to analysing time-series data, using relevant feature transformations and unsupervised machine learning methods to uncover anomalous activity.
Different types of anomalies
Our approach stems from the understanding that anomalous activity may present in the data in several ways. We identify three general types of anomalies: point anomalies, regime anomalies and pattern anomalies.
As the name suggests, point anomalies are single instances in the data that significantly differ from the majority of the time-series. Naively, they could be thought of as extreme highs or extreme lows. However, this simplistic view disregards any context in which we might observe these occurrences. Hence, in Math Labs, we are trying to engineer separate sets of features that allow us to capture both the global and local structure of the underlying data. This way, each data point could be understood and classified contextually; greatly improving the performance and explainability of our models.

In certain cases, it is important to capture the overall underlying state of the time series. With regime anomalies, we are trying to capture time windows where the data shares a similar set of attributes. Firstly, this allows us to flag different regimes in the duration of the time-series. And
secondly, we are able to identify the transition periods from one state to another. By analysing the sequences of regimes and the properties of their transitions we are able to detect behaviours otherwise hidden in the standard approaches.

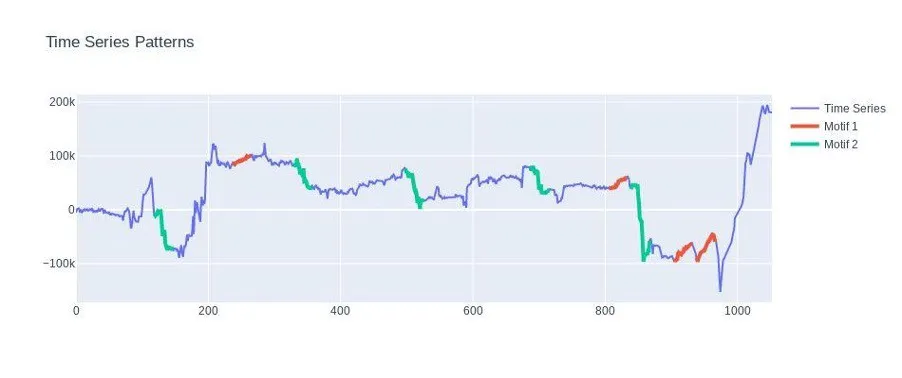
Finally, we are also looking at the shape of the data. The main idea in this approach is to identify whether the time-series contains very similar patterns that frequently repeat; such as heartbeats on an ECG monitor. Or conversely, find patterns that are very surprising in shape when compared to the rest of the data. We do this by careful analysis of the subsequences of the original time-series which results in a set of motifs and discords that describe the data. By studying the appearances of discords or the changes in the motifs we are capable of capturing anomalous patterns throughout the data.
Anomalies within a larger group
Another major area of interest for us is to perform the aforementioned analyses in the presence of interacting entities. These could range from anything from the traders inside a bank to a series of interacting mechanical components. An important attribute of these entities is that they have both their individual behaviour as well as behaviour in the context of the larger group. Therefore, when we are trying to identify anomalous behaviour for an entity, we need to separate the instances when the entity is behaving strangely with respect to its usual behaviour or whether the particular entity is anomalous with respect to the rest of the entities. Depending on the use case, either or both of these viewpoints might be of interest.
A specific use-case that we are currently working on with a key FS partner is concerned with finding fraudulent behaviour within FOREX transactions.
We are interested in identifying the many recurring patterns in sequences of trading. By comparing these patterns in a trader’s folder with the patterns of other traders we can identify pattern anomalies, potentially marking repeated fraudulent or suspicious activity. These are particularly interesting anomalies as they are not anomalous in the context of their time series, by virtue of being patterns, and thus would not be uncovered by the first two approaches. However, these patterns have characteristics which set them apart from other patterns, and in this sense are considered anomalous, and may, therefore, indicate activity worthy of further investigation. This latter approach uses our pattern identifying toolbox to extract patterns from time-series data. Features are extracted from these patterns using time warping methods which are then fed into anomaly detection algorithm which recover those patterns that are most anomalous across trading folders.
Conclusion
Anomaly detection is a very active area of research within the machine learning community. It has a multitude of use cases ranging from outlier detection, fraud detection to failure prediction. In Math Labs we believe that our comprehensive approaches to anomaly type classification and the tools we develop for anomaly detection provide a unique and robust path for the creation of unsupervised methods for anomaly detection.